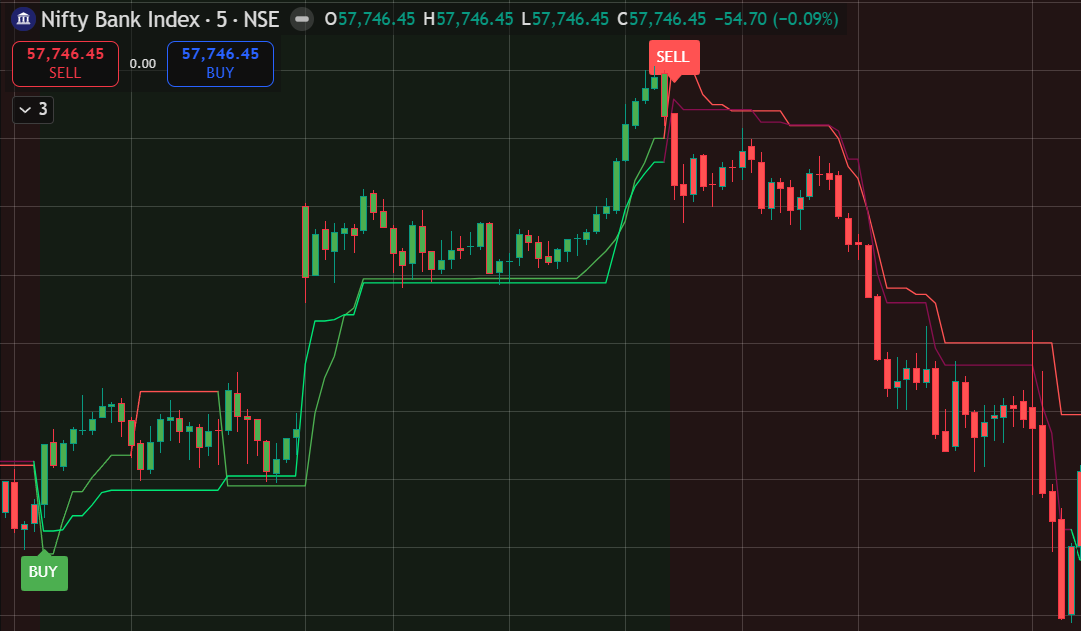
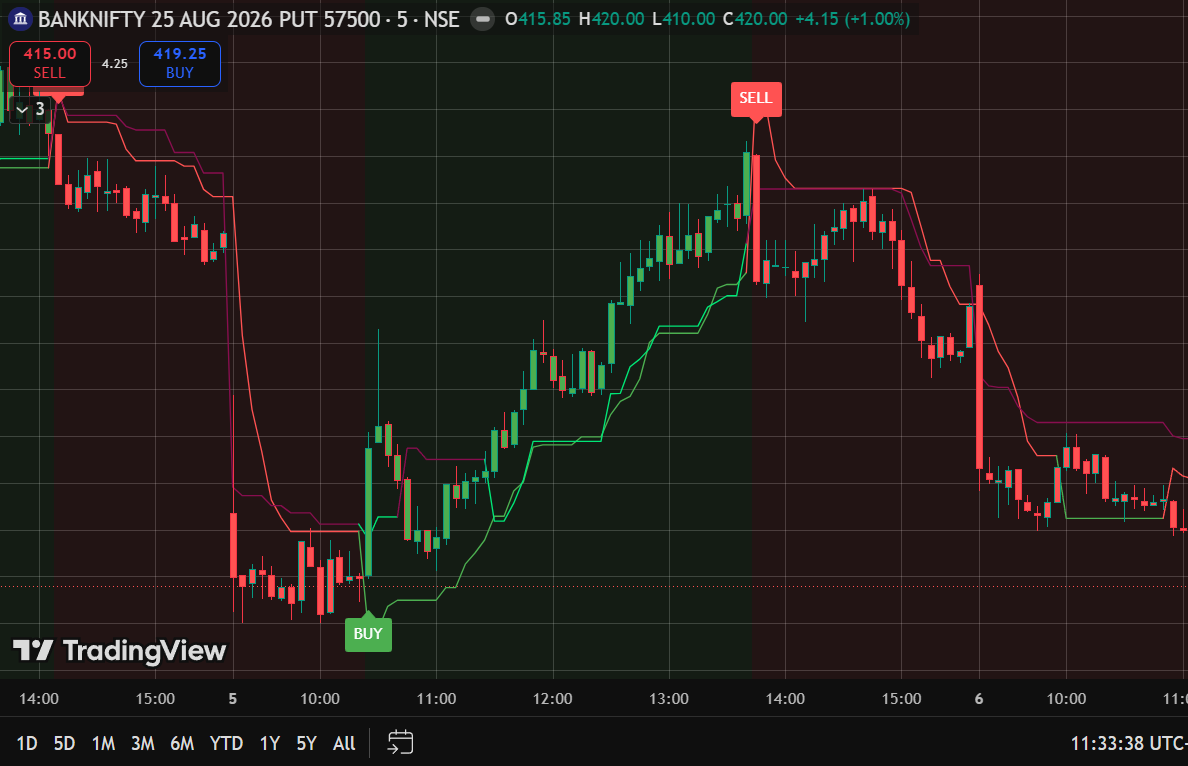
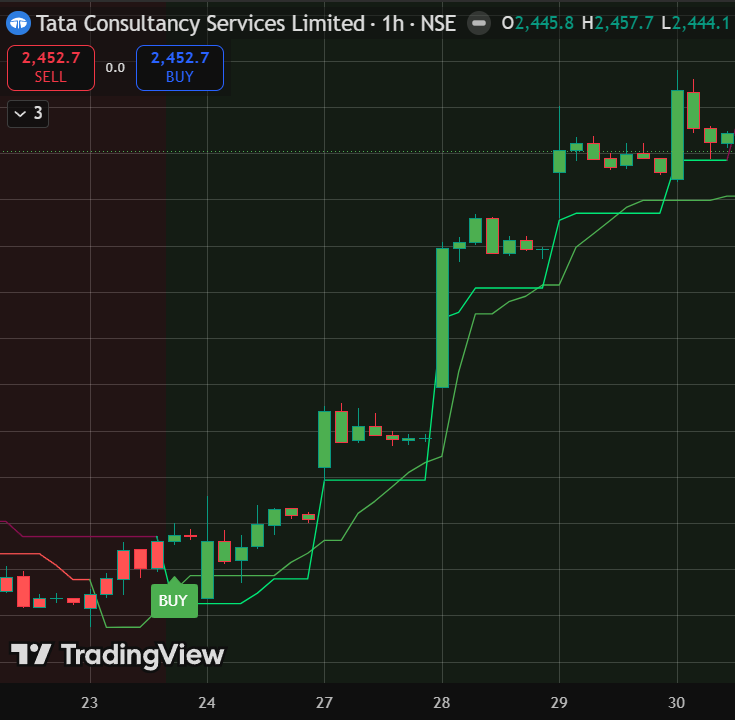
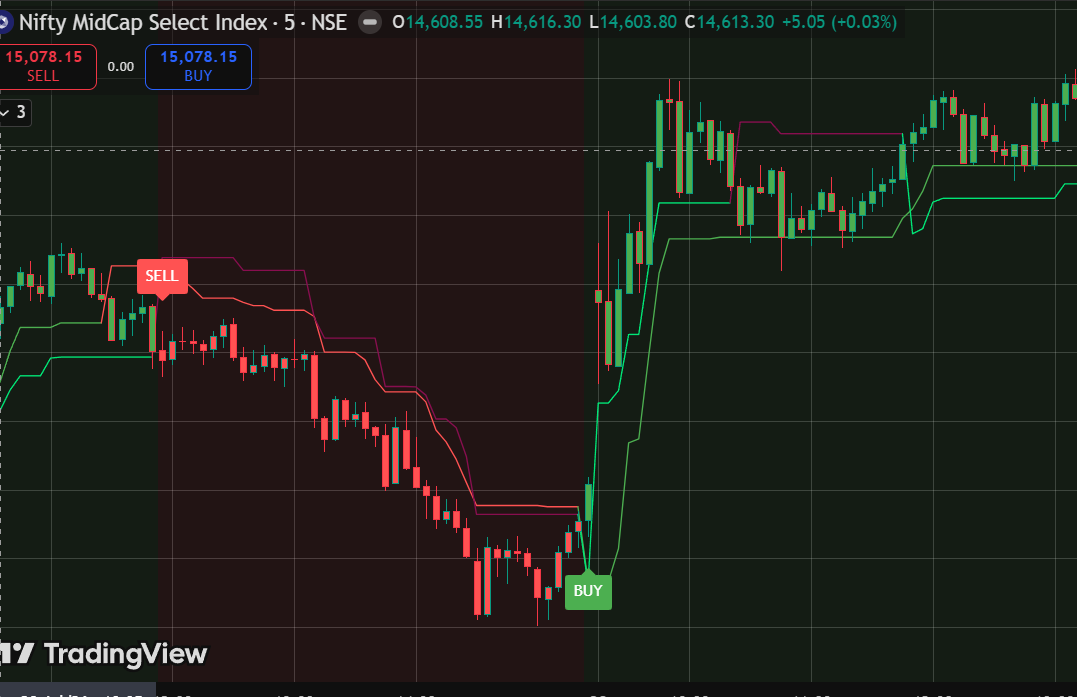
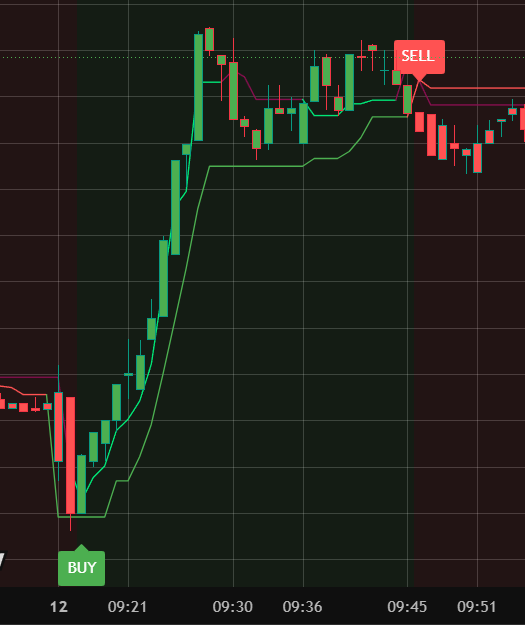
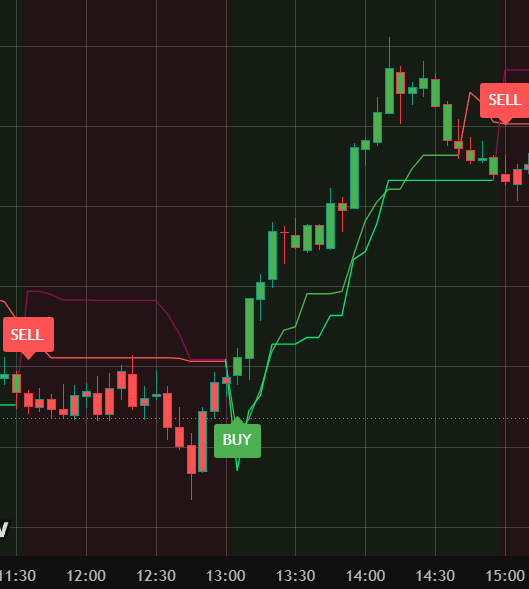
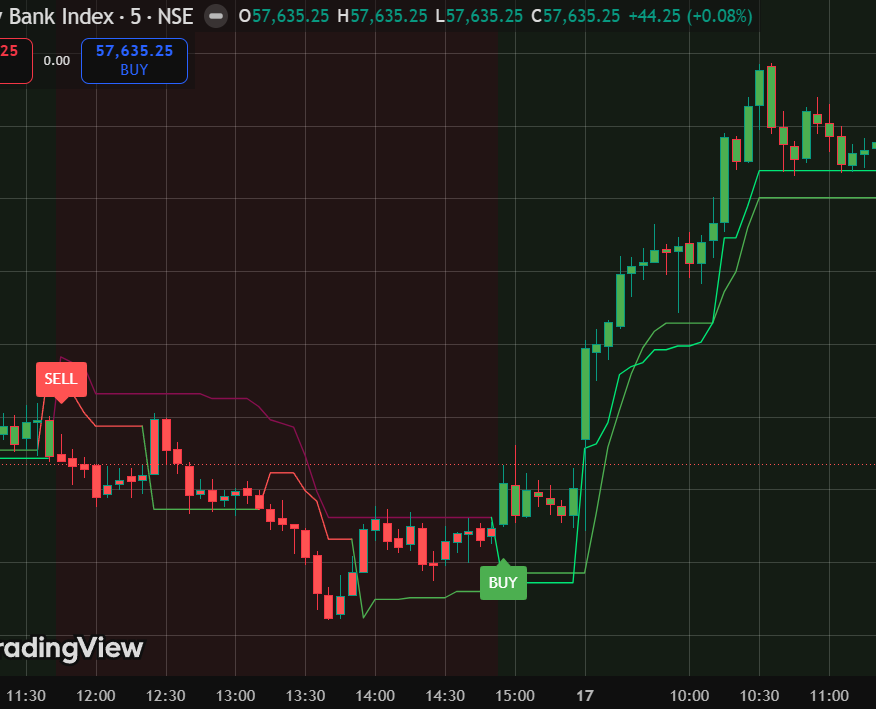
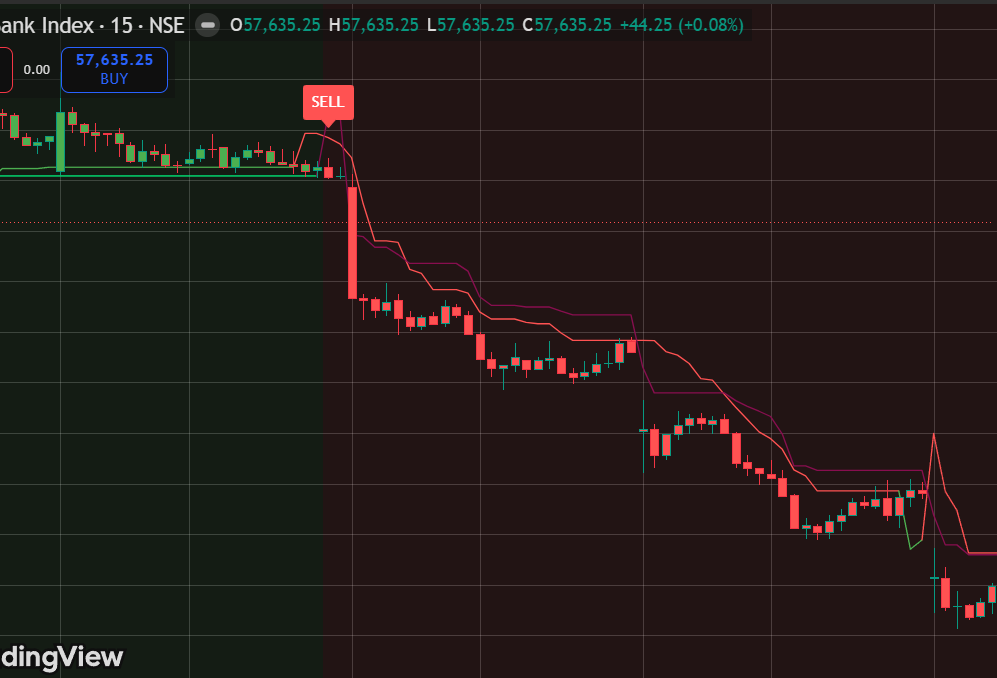
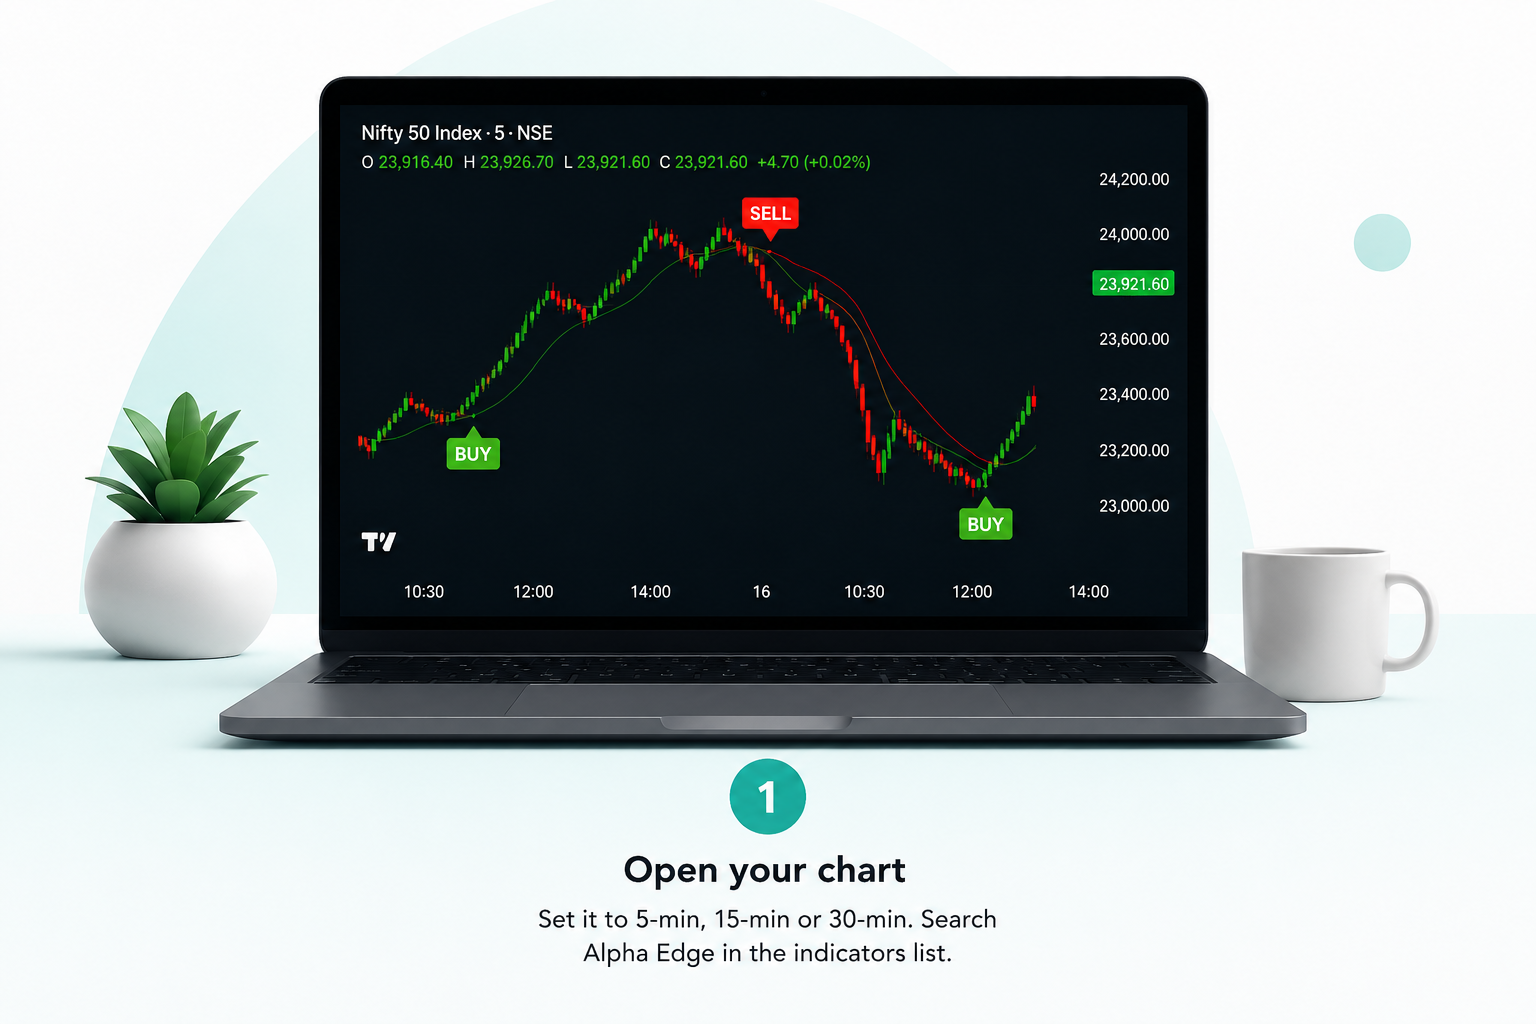
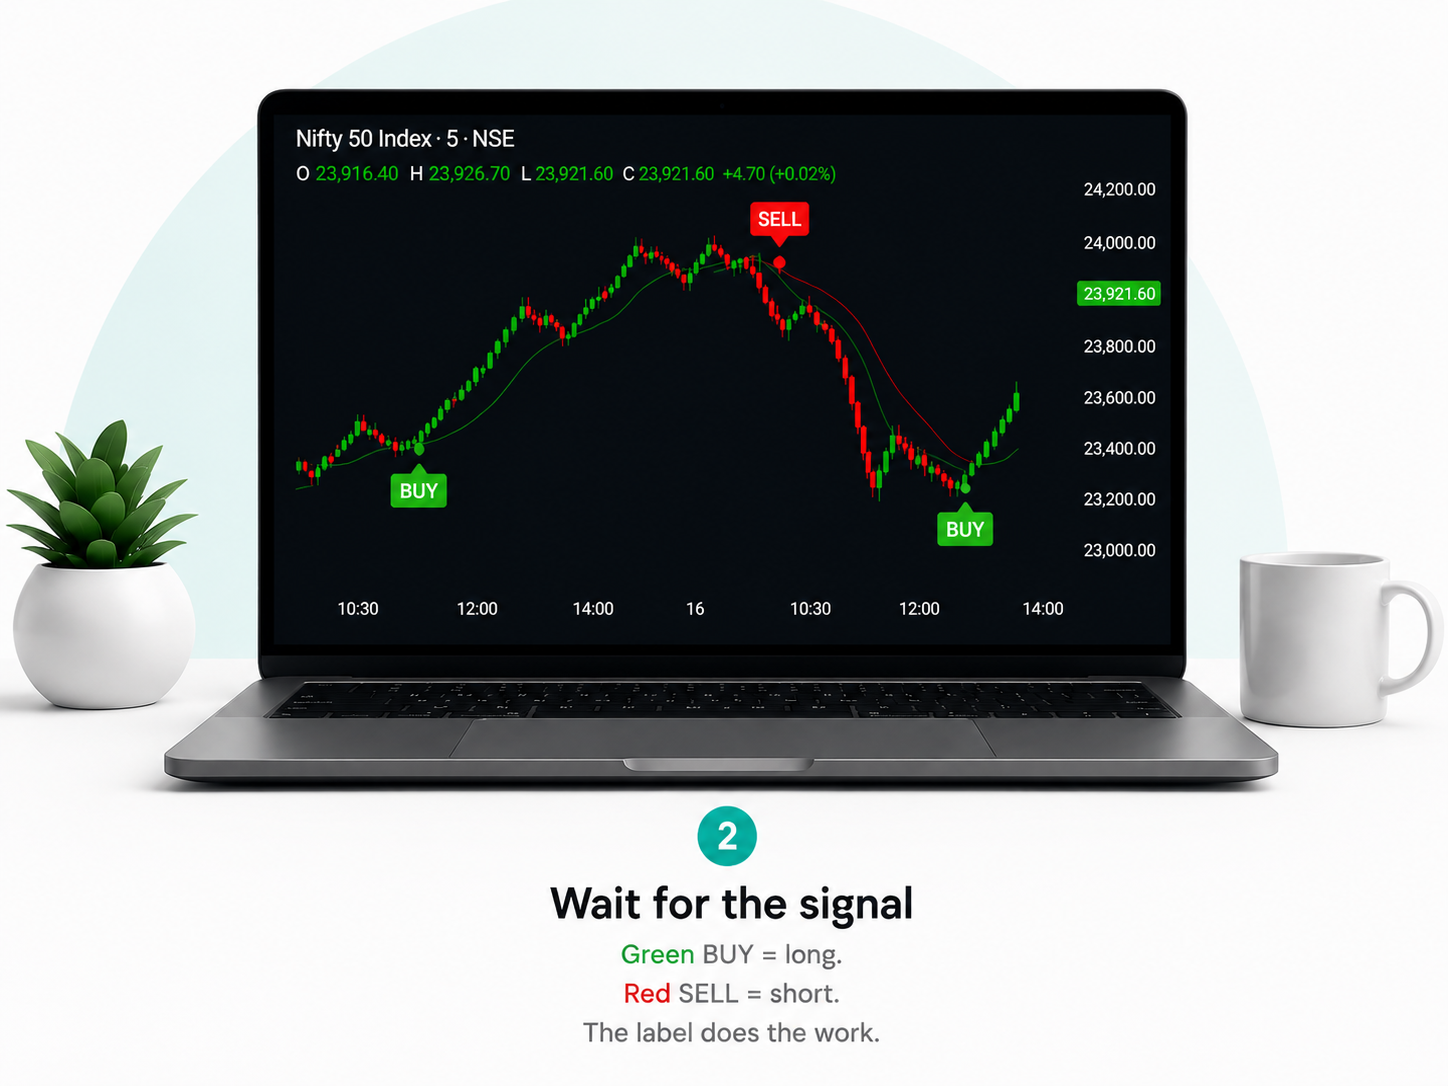
AlphaEdge turns busy charts into a clear colour-coded view. Green candles and BUY labels, red candles and SELL labels. No stack of indicators to decode, just a simple visual system you can apply with your own risk rules.
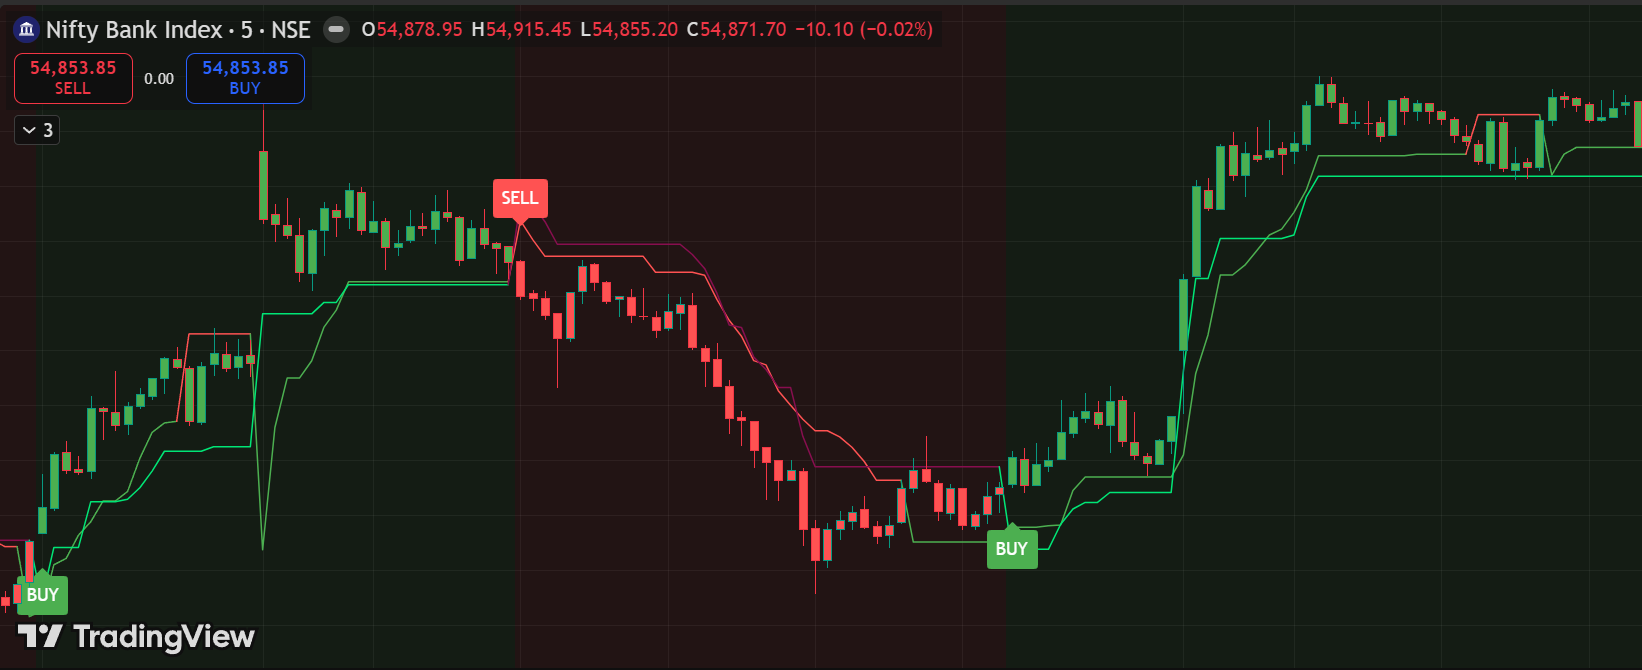
Bank Nifty · SELL → BUY
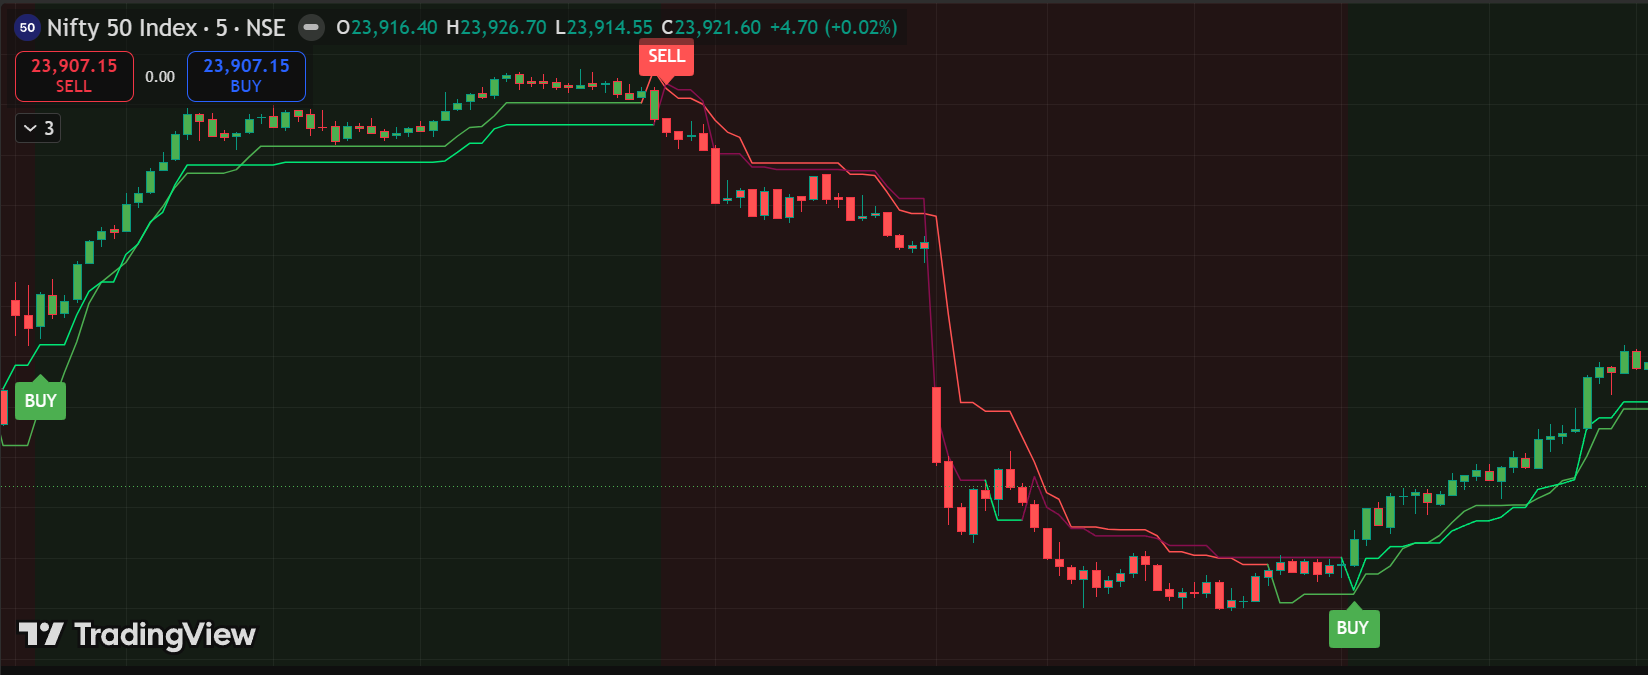
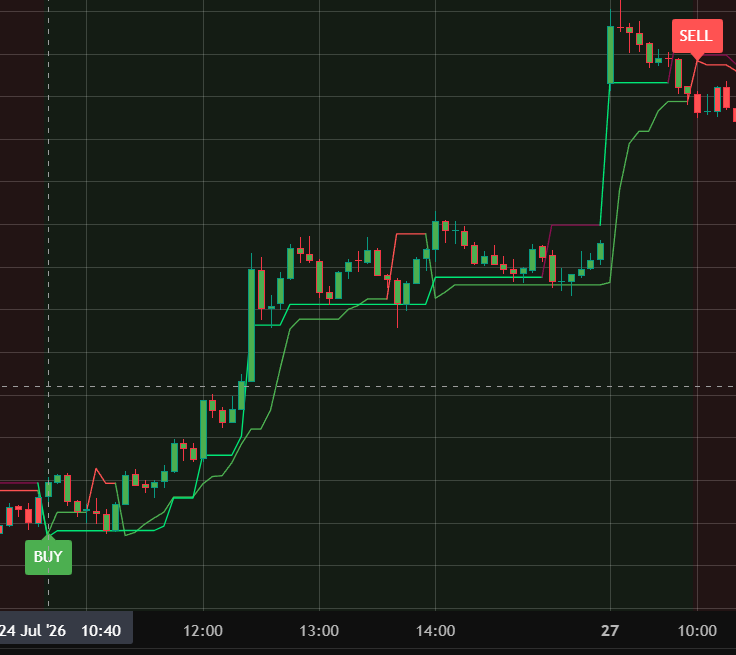
Nifty 50 · BUY signal
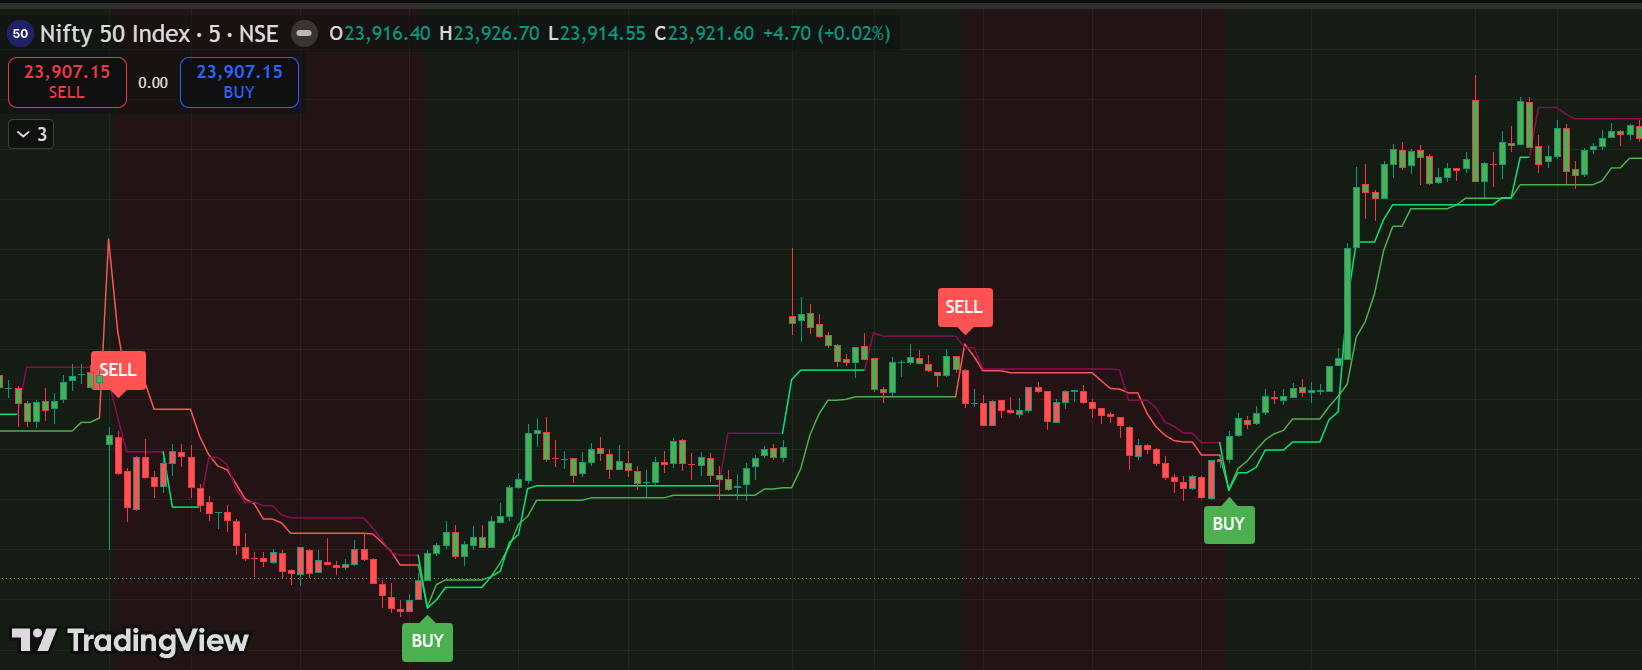
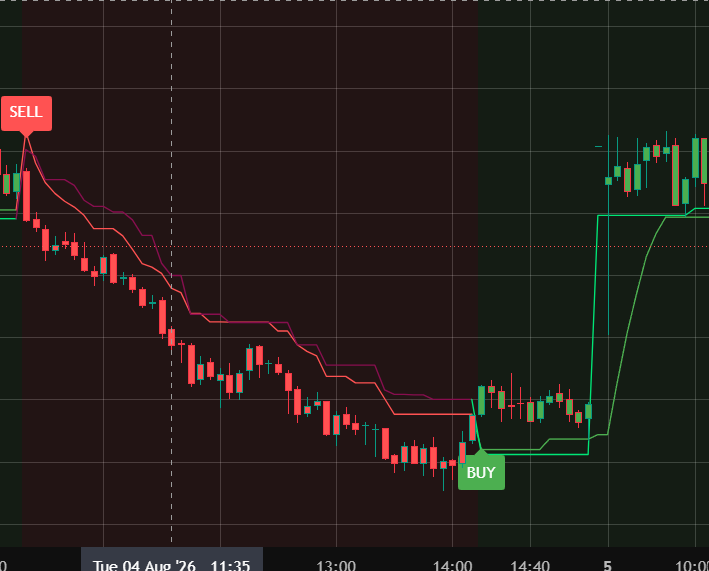
Nifty 50 · SELL signal
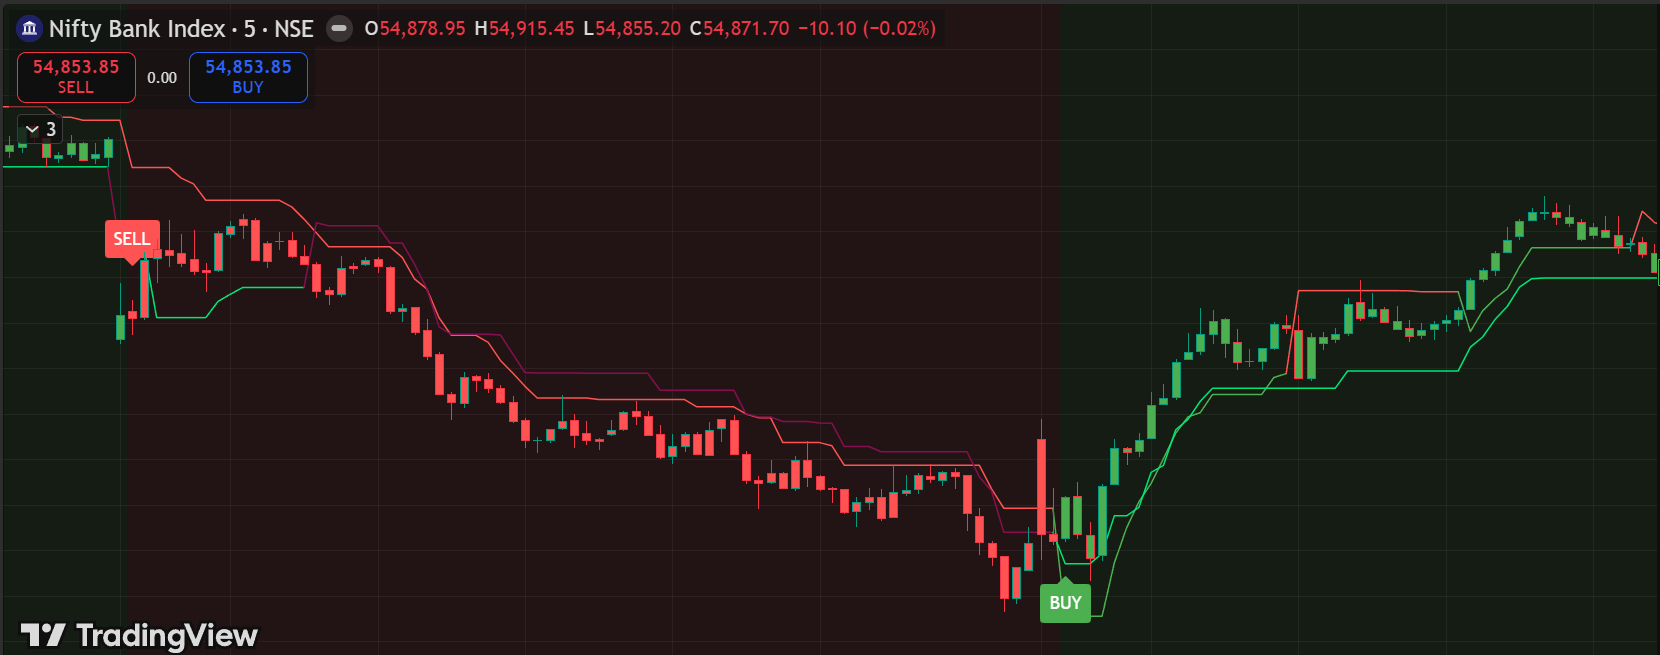
Bank Nifty · Full sessionEvery trader carries this weight silently. If any of this feels familiar, you're not alone — and it doesn't have to stay this way.

The awkward silence at dinner. The questions about a "real job." The pressure of explaining another red month to people who never wanted you trading in the first place.

Said with a smirk, every single time. You used to talk about your trades with pride. Now you change the subject before anyone can ask.

Heart racing before market open. Checking P&L in the middle of a family function. The stress that follows you home long after the market has closed.
AlphaEdge can't fix your family dinners. But it can fix the losses that started all of it.
Bring clarity to your charts — ₹1,499 →One indicator, multiple use cases. Stop switching between tools.

Quick 5-min signals

Hold through the colour cycle

Exact turning point entries

Nifty & Bank Nifty options

Multi-day higher TF holds
Pick your style and see example signals on the chart.

BUY bottom, SELL top

SELL into major downtrend

MA bands tighten

Green candles confirm

BUY → SELL → BUY

SELL peak, BUY base

Bands absorb noise

Clean high-vol entry

First 30 mins

Post-lunch end-to-end

Fast entries

Fewer, stronger

Full colour cycle

Caught on daily

Sector indices

High-conviction

We built AlphaEdge because we were tired of the same thing every Indian trader is tired of — too many lines, too many indicators, too many Telegram tips, and not enough clarity.
AlphaEdge isn't another indicator stacked on top. It's the one that replaces the stack.
Try the trade calculator →Simple, visible components. You can see exactly what is on your chart.
Unmissable signal badges. Zero interpretation.
Candles shift with the trend. See it first.
Dynamic support/resistance. Instant context.
Signals print on candle close and do not change afterwards.
A simple three-step routine you can adapt to your own plan.

Load Nifty or Bank Nifty on the 5-min chart with AlphaEdge applied.

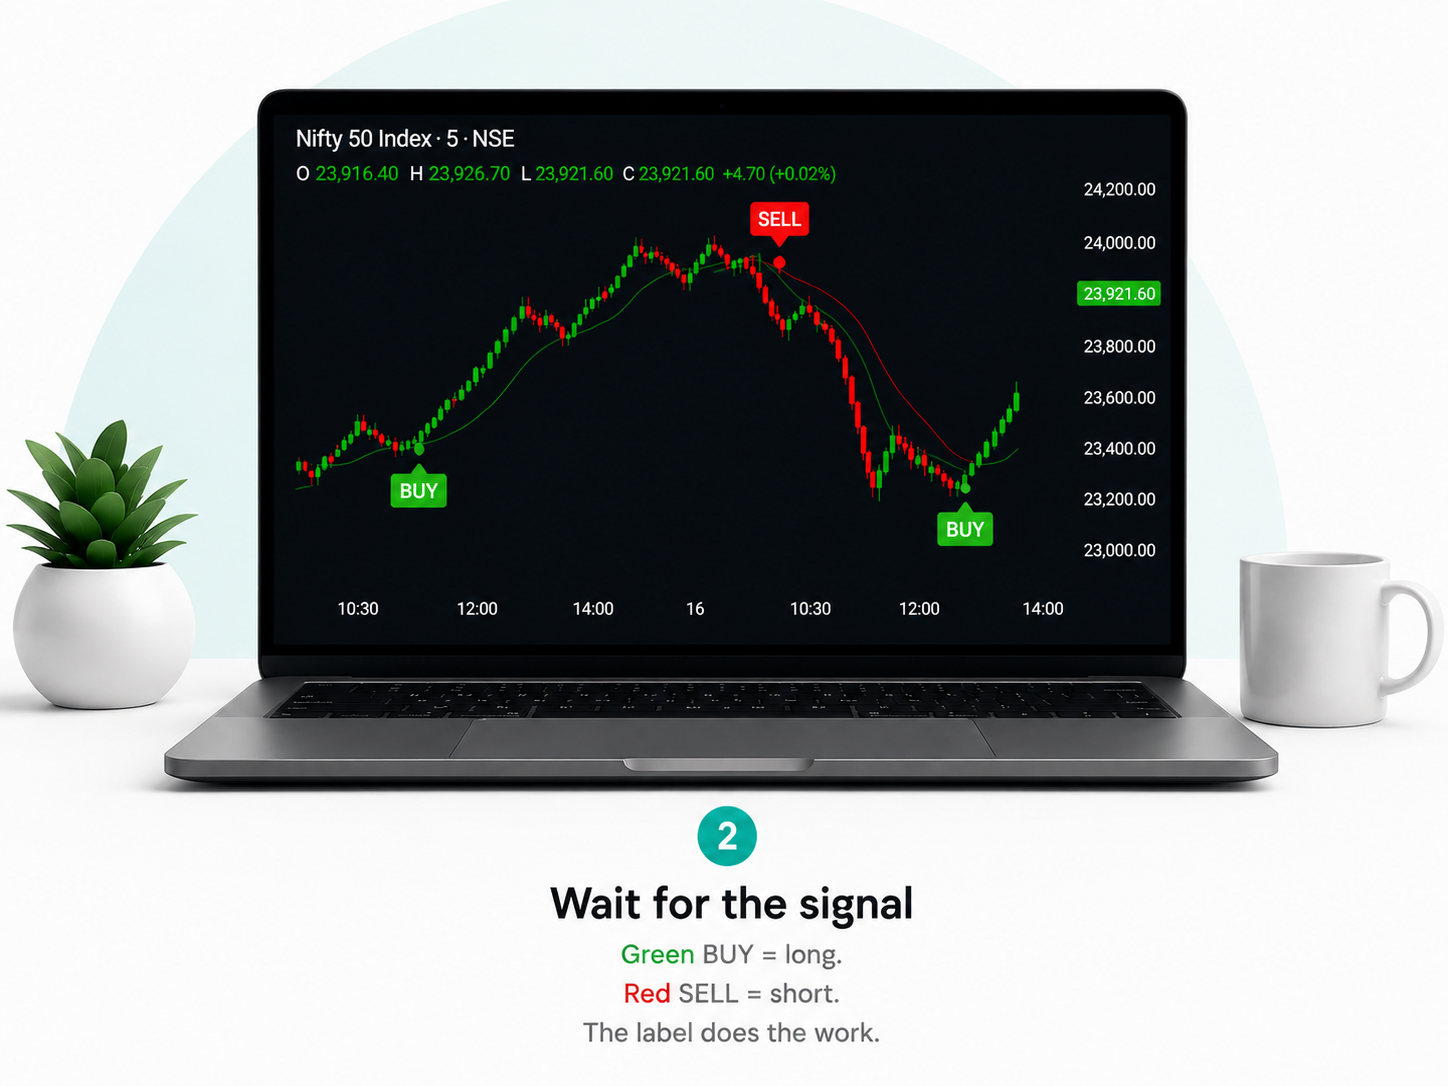
A green BUY label marks long setups, a red SELL label marks short setups. Plan your own entry, stop-loss and size.

Use the candle colour as trend context and manage exits with your own risk rules.
Same market. Same candles. A simpler view.
Enter your own trading days, trade size and win rate to see an illustrative what-if scenario. It is a planning tool, not a forecast, and it does not promise any result.
Try the calculator →Takes 20 seconds · No signup required
*What-if tool using your own assumptions. It does not predict or promise trading results.
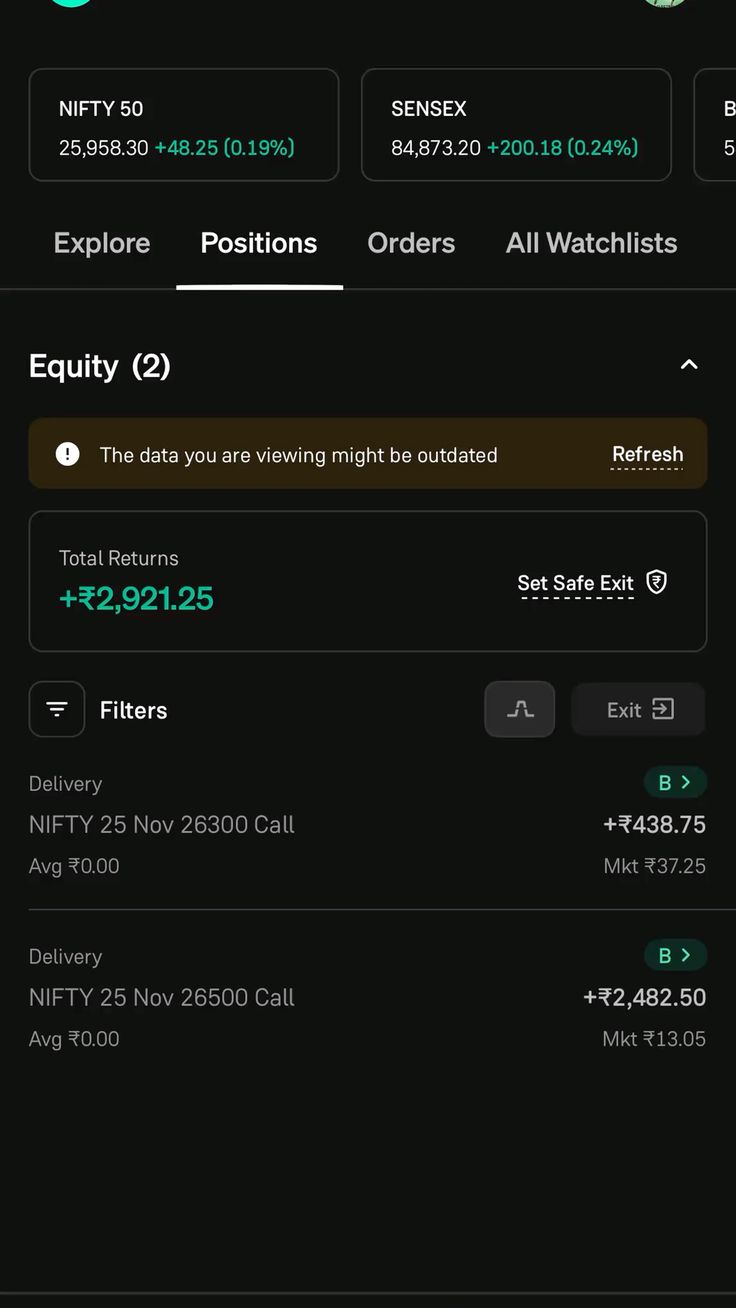
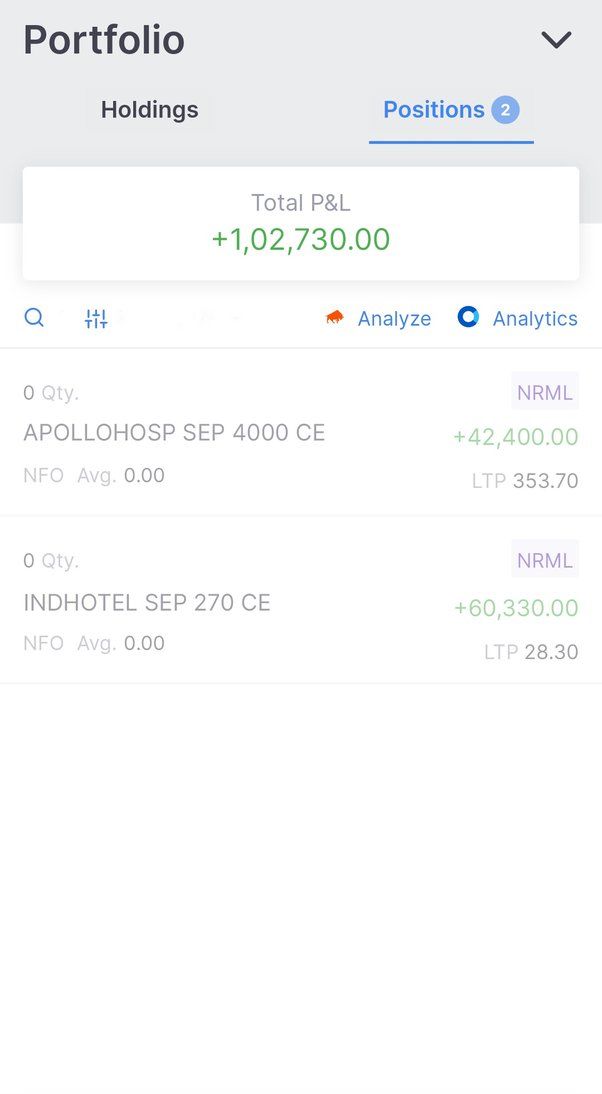
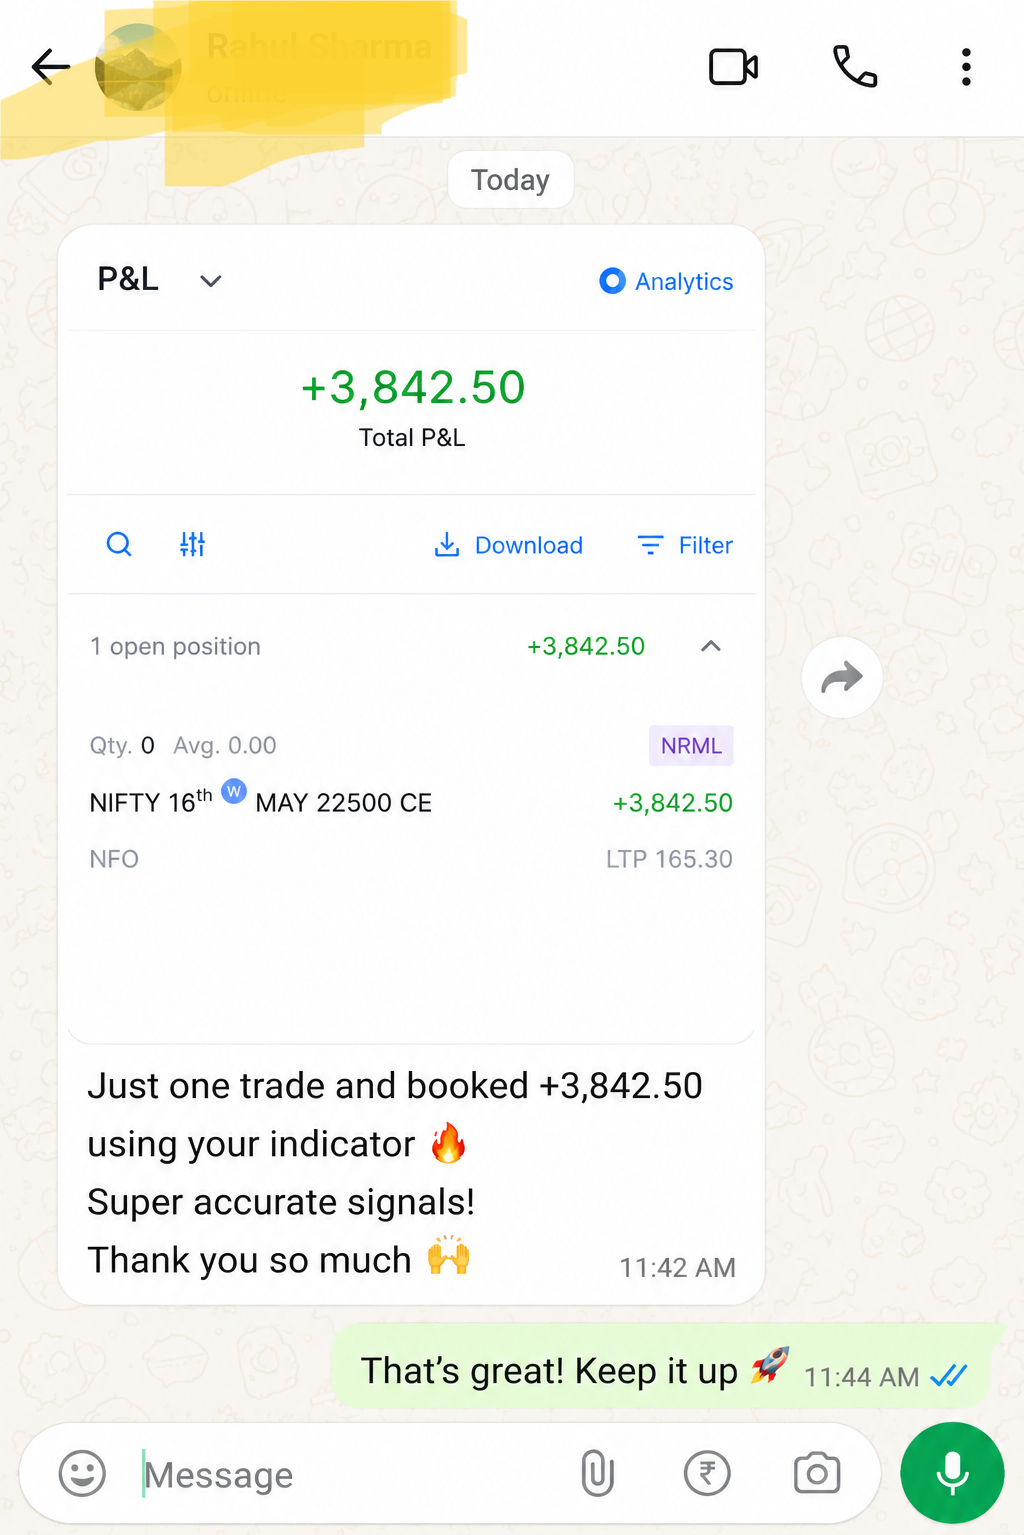
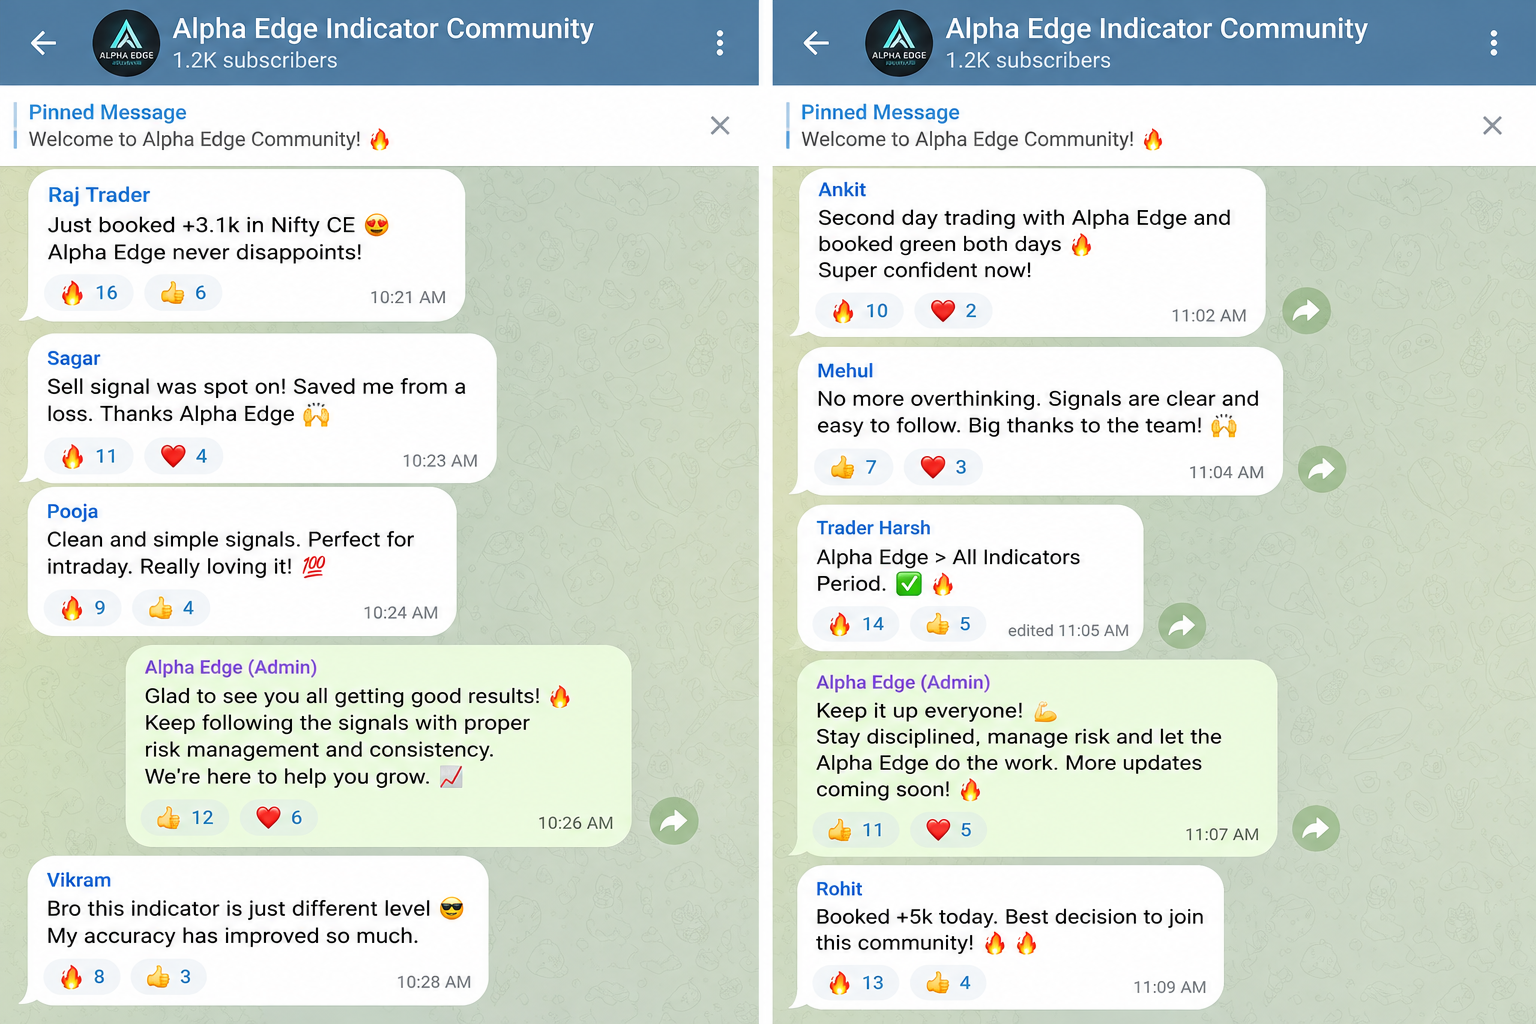
Screenshots shared by members. Individual results vary and are not a guarantee of future results.


Both plans include the full indicator. Choose monthly flexibility or a one-time lifetime payment.
Whether you're starting out or managing a 7-figure portfolio.
Tired of losing to YouTube strategies. Green = buy. Red = sell. That's your entire education.
Chart looks like a subway map. AlphaEdge replaces the chaos with one clean system.
You know the move but can't execute. The colours remove you from the equation.